- Published on
How to Identify Build-Time Bottlenecks Using CPU Profiling
- Authors

- Name
- Shashank Upadhyay
Introduction
When a production build slows down, the log tells you which phase ran — not which function consumed the CPU. Compilation, sealing, and code generation can each take minutes on a large codebase, and "webpack is slow" is not actionable.
CPU profiling closes that gap. Node.js can record where the process spent time during next build, and tools like cpupro make large V8 profiles navigable. This post covers the full workflow: capture a profile, read the viewer, and isolate a hypothesis worth investigating in source code.
- When Profiling Helps
- Step 1: Capture a CPU Profile During Build
- Step 2: Open the Profile
- Step 3: Read the Viewer
- Step 4: Form a Hypothesis
- Step 5: Validate Before Fixing
- Takeaways
- What's Next
When Profiling Helps
Reach for a CPU profile when:
- Build time regressed without an obvious config change
- A single phase (seal, optimize, code generation) dominates wall time
- You suspect redundant work at scale — graph walks, repeated hashing, cache misses
Profiling is less useful when the bottleneck is I/O (disk, network) or waiting on subprocesses. The profile will show idle gaps, not the root cause.
Next.js adds its own layer
This post uses next build, so the profile is not webpack alone. Next.js runs its own pipeline on top — page collection, static optimization, type checking (if enabled), and framework-specific webpack configuration. You will see frames under next/dist/ alongside webpack/ and enhanced-resolve/.
When a wide block sits in Next.js code, do not assume webpack is at fault until you drill into callees. Conversely, a hotspot under webpack/lib/ during next build is still webpack — Next.js is just the entry point that invoked it.
Step 1: Capture a CPU Profile During Build
Node.js ships with a built-in CPU profiler. Passing --cpu-prof to the Node process that runs next build produces a .cpuprofile file when the build exits. No extra dependencies, no instrumentation inside application code.
Most projects invoke next build through a package manager script. A thin wrapper forwards the profiler flags when needed.
Build wrapper script
Create scripts/build-with-cpu-profile.js:
const { spawnSync } = require('child_process');
const path = require('path');

const projectRoot = path.join(__dirname, '..');
const nextBin = path.join(projectRoot, 'node_modules', '.bin', 'next');
const enableCpuProfile = process.env.GENERATE_CPU_PROFILE === 'true';

const nodeArgs = enableCpuProfile
  ? [
      '--cpu-prof',
      '--cpu-prof-name=build.cpuprofile',
      // optional: '--cpu-prof-dir=/tmp/profiles',
      // optional: '--cpu-prof-interval=500',
    ]
  : [];

const result = spawnSync(process.execPath, [...nodeArgs, nextBin, 'build'], {
  stdio: 'inherit',
  cwd: projectRoot,
  env: process.env,
});

process.exit(result.status ?? 1);
Wire it in package.json
{
  "scripts": {
    "build": "node scripts/build-with-cpu-profile.js",
    "build:profile": "GENERATE_CPU_PROFILE=true node scripts/build-with-cpu-profile.js"
  }
}
How to run
# Dedicated script
yarn build:profile

# Or via env flag
GENERATE_CPU_PROFILE=true yarn build
When the build completes, Node writes build.cpuprofile in the project root. That file is the input for analysis.
Profiler flags worth knowing
Besides --cpu-prof-name (output filename):
--cpu-prof-dir— directory for the.cpuprofilefile. Defaults to the current working directory. Useful in CI when you want profiles in a known upload path.--cpu-prof-interval— sampling interval in microseconds. Default is 1000 (1 ms). Lower values (e.g.500or250) give finer granularity for short builds where 1 ms sampling can miss brief hotspots — at the cost of a larger profile file.
Practical notes:
- Profile a production build, not
next dev. Dev mode has different hot paths and will mislead you. - Run on a machine with stable CPU load. Background contention distorts self-time rankings.
- Add
*.cpuprofileto.gitignore. These files are large. - For K8s/CI runners: If your production builds run on ephemeral Kubernetes runners, modify the script to upload the CPU profile to cloud storage (S3, GCS, etc.) and log the download link in the console. That way you can retrieve
build.cpuprofileeven after the runner terminates.
Step 2: Open the Profile
Chrome DevTools can load .cpuprofile files (Performance → Load profile), but large webpack builds produce profiles that are slow to navigate there.
cpupro is purpose-built for V8 CPU profiles of any size:
- Hosted viewer: discoveryjs.github.io/cpupro
- CLI:
npx cpupro build.cpuprofile - Source: github.com/discoveryjs/cpupro
Drop the file on the page or pass it to the CLI. The viewer embeds the data in an HTML report you can share with your team.
Step 3: Read the Viewer
The sections below describe what to look for. Annotated screenshots from cpupro are included so you can match the prose to the UI.
Flamegraph (top-down)
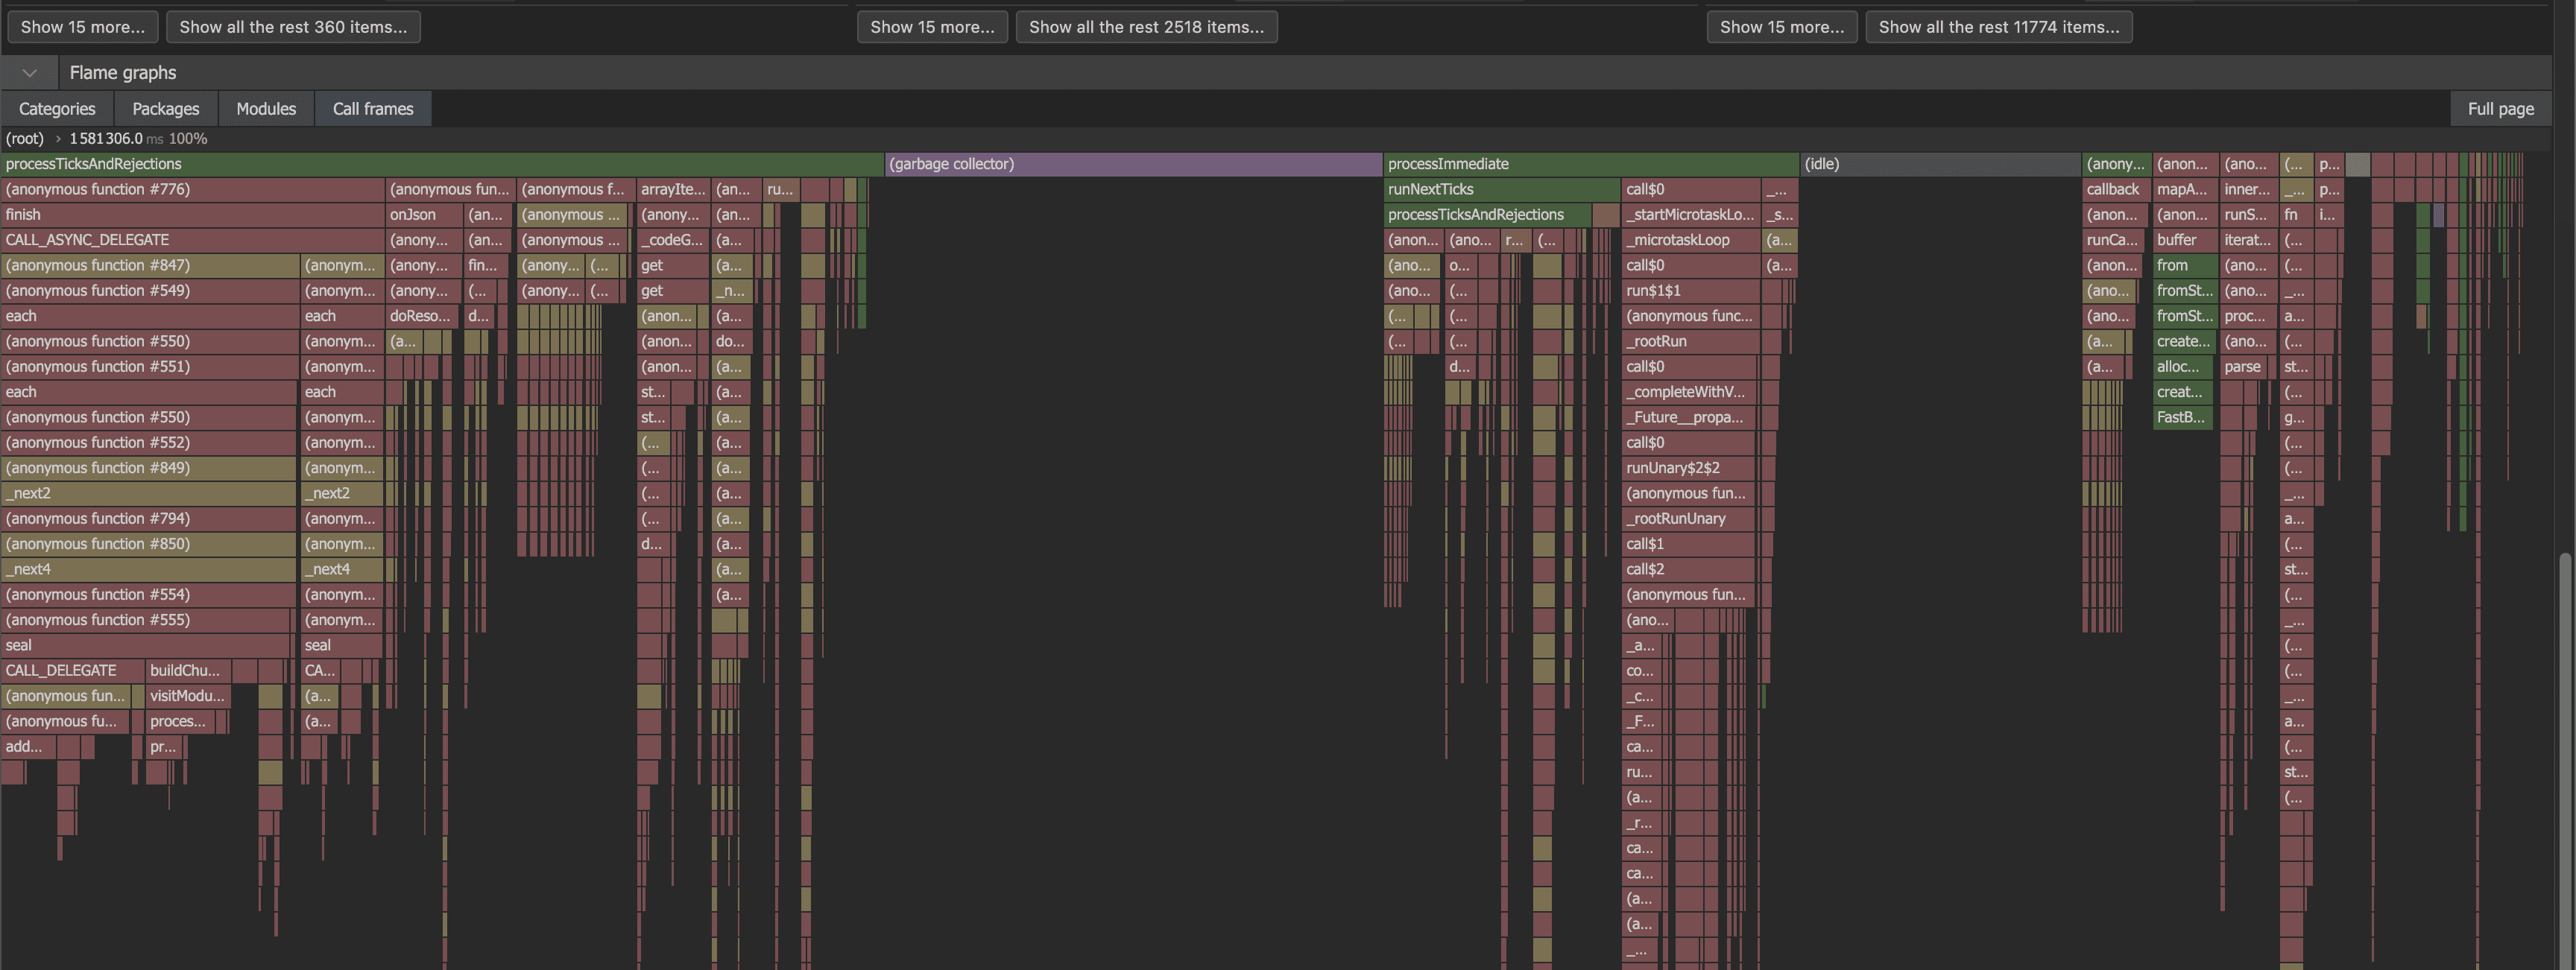
Start here for orientation. The timeline at the top spans the full build; each column is a stack sample, and width is time. Tall, wide stacks show where the process spent continuous time.
In a webpack-powered next build you expect dense blocks under processTicksAndRejections — compilation, seal, chunk graph walks, and code generation. Also normal: purple (garbage collector) bands and grey (idle) gaps (I/O or waiting, not JavaScript CPU).
Look for an unexpectedly wide plateau — a function that should be cheap but spans many columns at the same stack depth. In the profile below, the flat block around the seal / visitModu… region during minutes 17–21 is the kind of shape worth clicking into.
Call frames (drill-down)
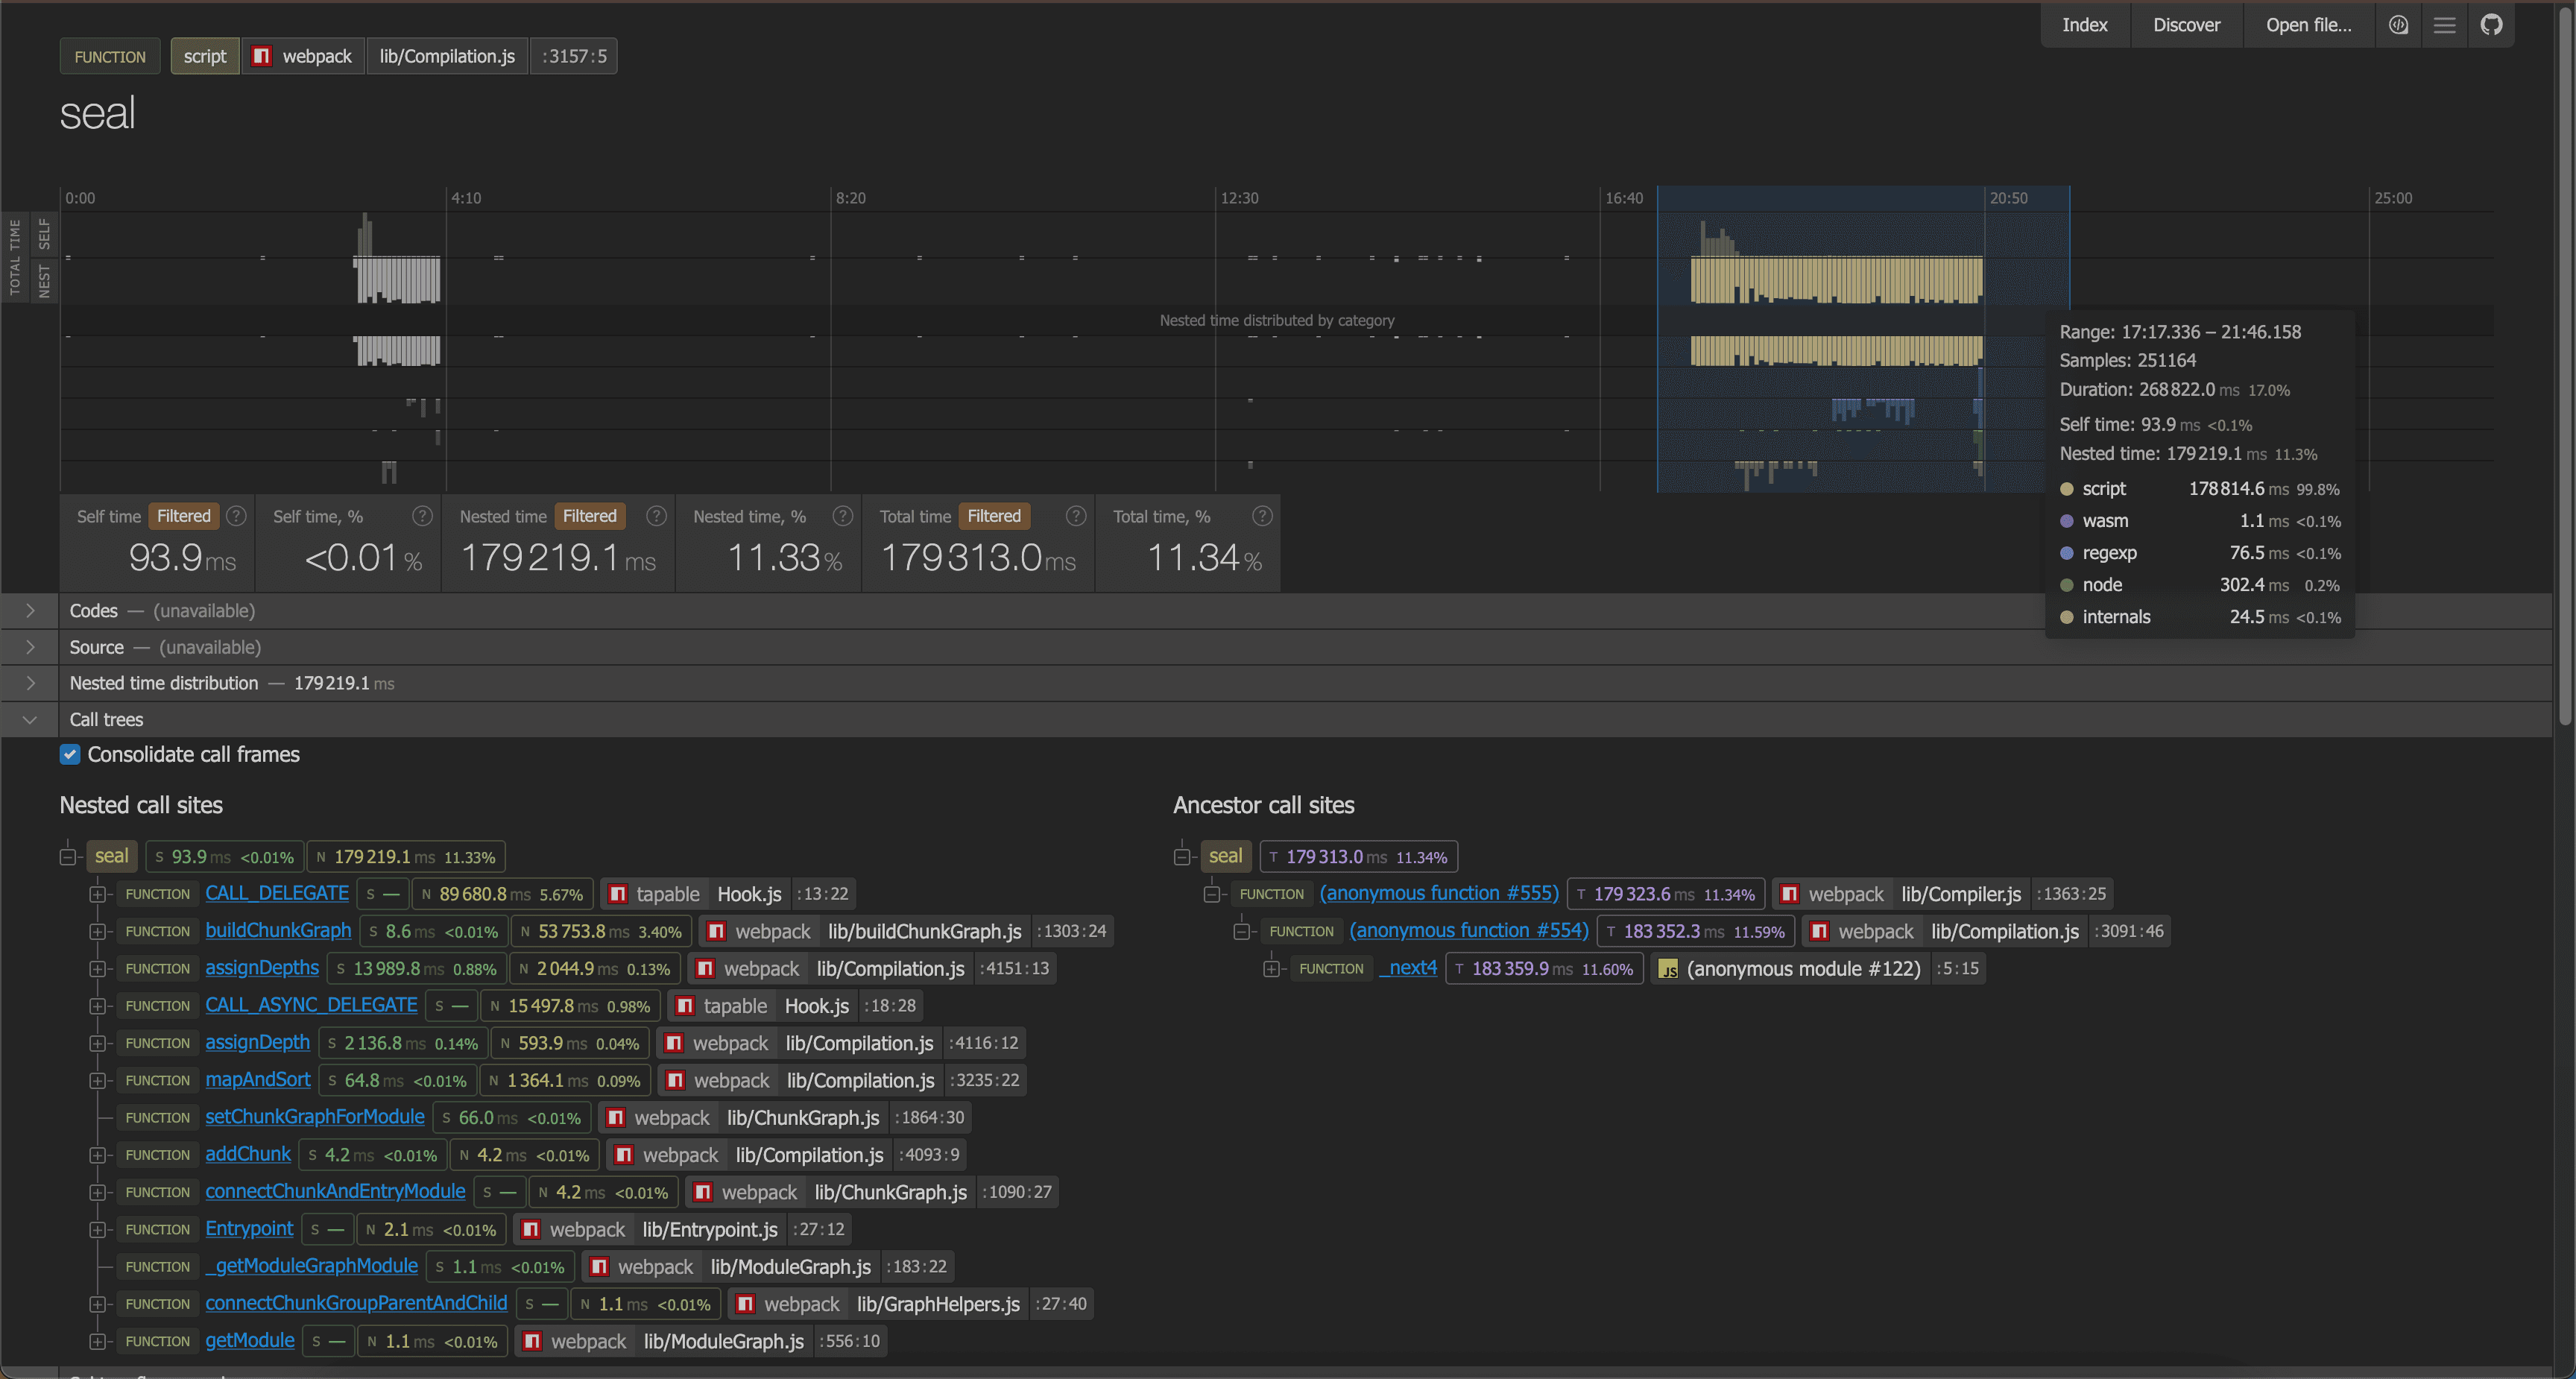
Click a plateau frame to open the Call frames tab. cpupro shows self-time vs nested time, a timeline slice for that function, and two trees:
- Nested call sites — what the selected function called (callees). Here
sealinCompilation.jsspends ~179 s nested time mostly inCALL_DELEGATEhooks,assignDepths, and chunk-graph work — not insealitself (93 ms self-time). - Ancestor call sites — how execution reached this frame (callers back to
Compiler.js).
Search (seal, codeGeneration, webpack/lib/) narrows the flamegraph first; call frames then tell you which hook or helper inside the phase owns the time.
Bottom-up (self-time)
For leaf hotspots — especially repeated graph walks or hash calls — switch to bottom-up and sort by self-time. Self-time ranks functions by CPU consumed directly, not through callees. That view surfaces tight loops the call-frame tree can bury under deep delegate stacks.
Sort by self-time and scan the top entries. If a graph-walking or hashing function ranks high despite sounding trivial, note it and cross-check call frequency in the call-frame view above.
Step 4: Form a Hypothesis
Profiling gives you a where and a how much. The hypothesis connects that to why.
A useful workflow:
- Locate the stall — find the widest time block in the flamegraph during the slow phase
- Identify the hotspot — bottom-up sort; note the top self-time functions
- Check call frequency — is the function invoked once or thousands of times?
- Cross-reference graph shape — see below
- State the hypothesis — e.g. "Function X walks the module graph on every external entry; with N externals and M concatenated modules, that is N×M redundant traversals"
A good hypothesis is falsifiable. You should be able to grep the source, read the call site, and confirm or reject it without guessing.
Cross-reference graph shape (concretely)
Step 4 is where many profiles stall in the abstract. You need counts from the build, not guesses:
- Webpack stats JSON — run
webpack --json > stats.jsonon a representative config, or addwebpack-stats-plugin/stats: { all: false, modules: true, chunks: true }to your build and write the output to disk. From the stats object, count modules withmoduleType/identifierindicating externals, total chunks, and compilation hash entries. - cpupro call counts — once you filter to a suspect function, check how many times it appears in the call tree. Thousands of invocations × non-trivial per-call work is the pattern behind most "cheap function, expensive build" bugs.
- Three-way attribution — when a leaf function runs inside nested loops (externals × concatenated modules × runtimes), multiply the dimensions you can measure separately. A small script that reads stats JSON and prints
{ externals, concatenatedModules, runtimes }is enough to turn "this walk feels redundant" into "this walk runs ~N×M times per build."
If the product of those counts matches the order of magnitude of CPU time you see in the profile, you have a hypothesis worth reading source for.
Example signals
| Signal in profile | Likely hypothesis |
|---|---|
| Same leaf function, high self-time, many invocations | Redundant per-item work in a loop |
| Wide plateau in one plugin's code path | Algorithmic cost in that plugin |
| Flat distribution, no dominant function | Many small costs; consider a different approach (build cache, fewer entries) |
| Gap with no samples | I/O wait or subprocess; profiling won't help |
Wide block under next/dist/ with no webpack callees | Next.js pipeline overhead, not bundler config |
Step 5: Validate Before Fixing
The profile is evidence, not proof. Before opening a PR:
- Read the source at the call site identified in the profile
- Confirm the expensive path is reachable in your configuration
- Check whether a feature flag or experiment gates the work (and whether it is enabled)
- Estimate whether skipping the work changes output (correctness check)
If the hypothesis holds, you have a targeted fix. If not, profile again after eliminating the false lead.
Takeaways
- Profile production builds —
yarn build:profilewith Node's--cpu-profis enough to start - Use cpupro for large profiles — better filtering and navigation than DevTools for webpack-scale builds
- Bottom-up self-time finds loops — the flamegraph shows structure; self-time finds repetition
- Separate Next.js from webpack — framework frames in the profile are not automatically bundler bugs
- End with a falsifiable hypothesis — the profile tells you where to read code, not what to change
What's Next
This workflow is general. The same steps apply whether the hotspot is in your application bundler config, a webpack plugin, or upstream in webpack core.
In a follow-up post, I will walk through a concrete case: using this process to find a redundant moduleGraph.isDeferred() traversal in webpack's ConcatenatedModule, land webpack#21096, and cut roughly 32% from a production build.